Tracking down a water leak with rtlamr
When my water bill arrived a couple weeks ago, I noticed it was higher than usual. I suspected a leaky appliance, but wasn’t sure what it might be.
I was already aware that Ottawa’s water meters use the ERT protocol, which can be received using an RTL-SDR dongle and rtlamr. I installed the program on an old laptop, and stored its output in a file with rtlamr | tee usage.txt. I checked my meter number and ran tail -f usage.txt | grep 12345678 to confirm I was receiving packets from it. Fresh packets were arriving every few minutes. After a few hours it became apparent that the resolution of the readings was 0.05 m³, and that the reading only changes once per hour, on the hour.
With this information in hand, I put together a Python script to extract my meter’s readings from the file, keep the first reading from each hour, and plot the results with Pyplot:
#!/usr/bin/env python3

import matplotlib.pyplot as plt
import dateutil.parser
import re

MY_ID = 12345678

regex = re.compile(r"{Time:(.*) SCM:{ID:\s*(\d*) .* Consumption:\s*(\d*) .*")
times = []
usages = []
last_time = None

for line in open('usage.txt'):
    result = regex.match(line)
    if not result:
        print("Error parsing line:")
        print(line)
        exit(1)

    id = int(result[2])
    if id != MY_ID:
        continue

    time = dateutil.parser.parse(result[1])
    measurement_time = time.replace(minute=0, second=0, microsecond=0)
    consumption = int(result[3]) / 100

    if measurement_time != last_time:
        times.append(measurement_time)
        usages.append(consumption)
        last_time = measurement_time

plt.figure(figsize=(14, 9))
plt.plot(times, usages)
plt.grid(True)
plt.show()
Here’s the result after a week collecting packets:
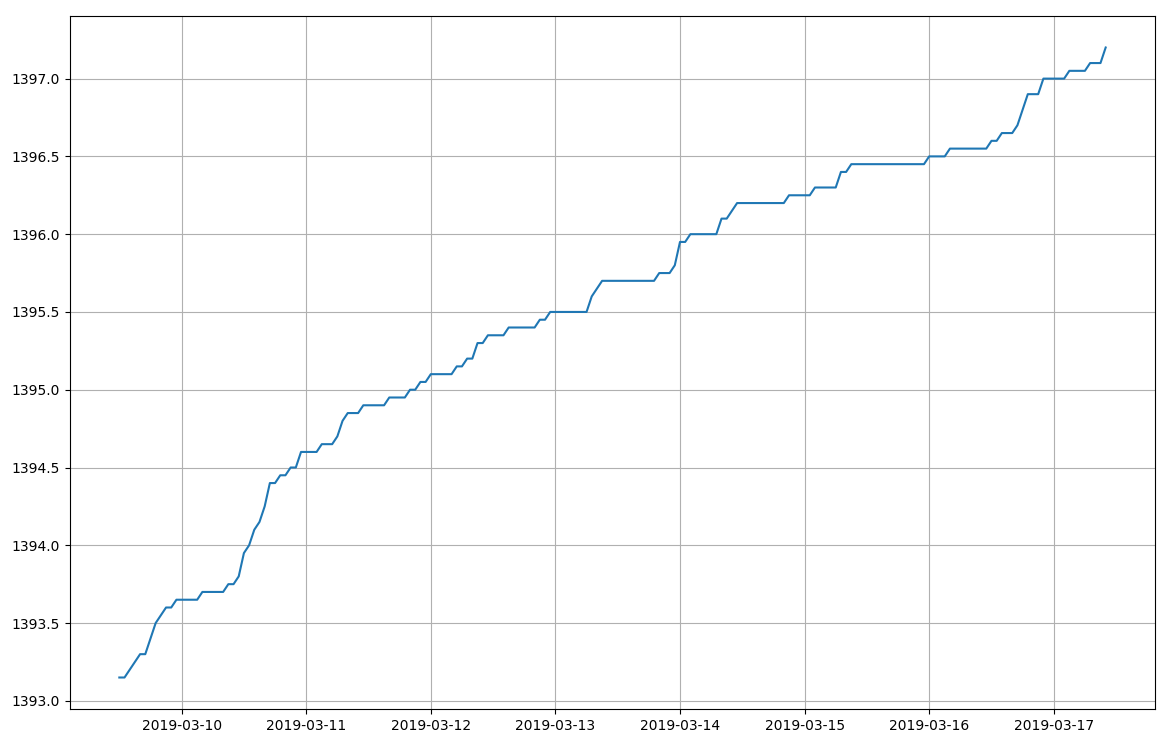
During the first few days, I observed that water was consumed at about 0.05 m³ every five hours even when I was away from home, suggesting that the leak was about 10 litres per hour. I turned off the input values to my toilets, and the next day the reading stayed constant all day. The flappers in two of the toilets had warped with age, and replacing them brought water consumption back to normal.
Of course, I could have just run down to the basement now and then to read the meter, but where would the fun be in that?